Events
Every night is its own result.
From Midweek Session to Saturday Signature: give your nights a name, and Stats shows what each one earned and how it compares with the nights it should be compared with.
Demo venue with sample data.
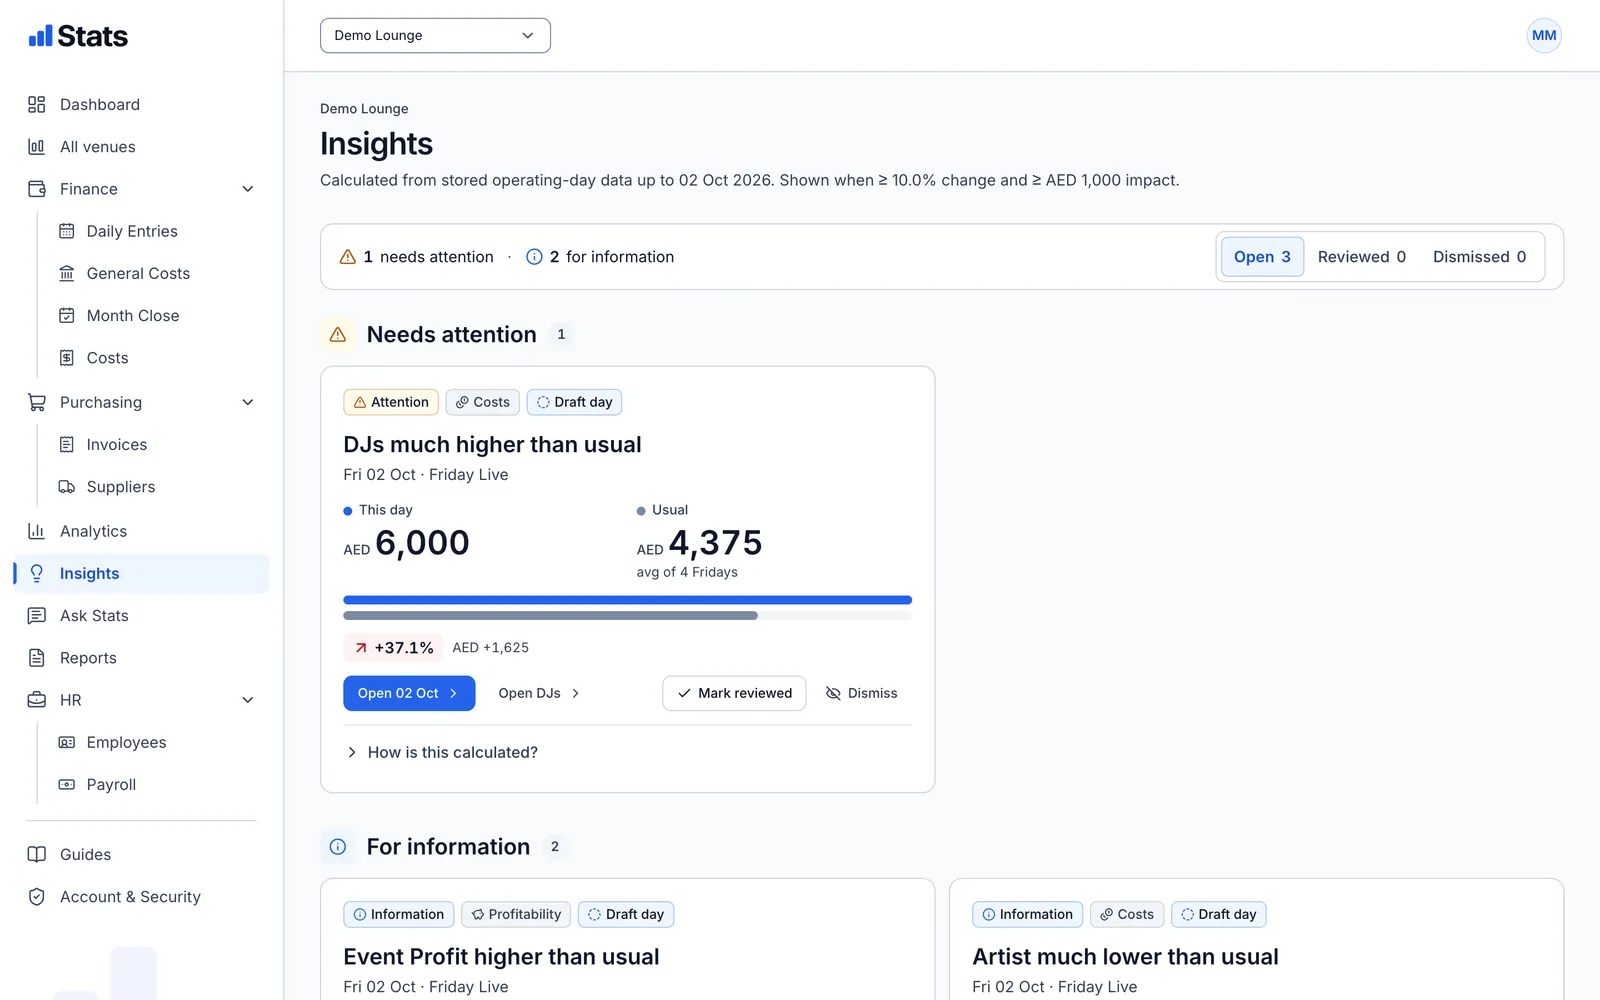
Compared the fair way
A Friday is compared with the Fridays before it, a month with the same period last month or last year.
Insights that show their working
By default only changes of at least 10% and AED 1,000 are raised, each with how it was calculated.
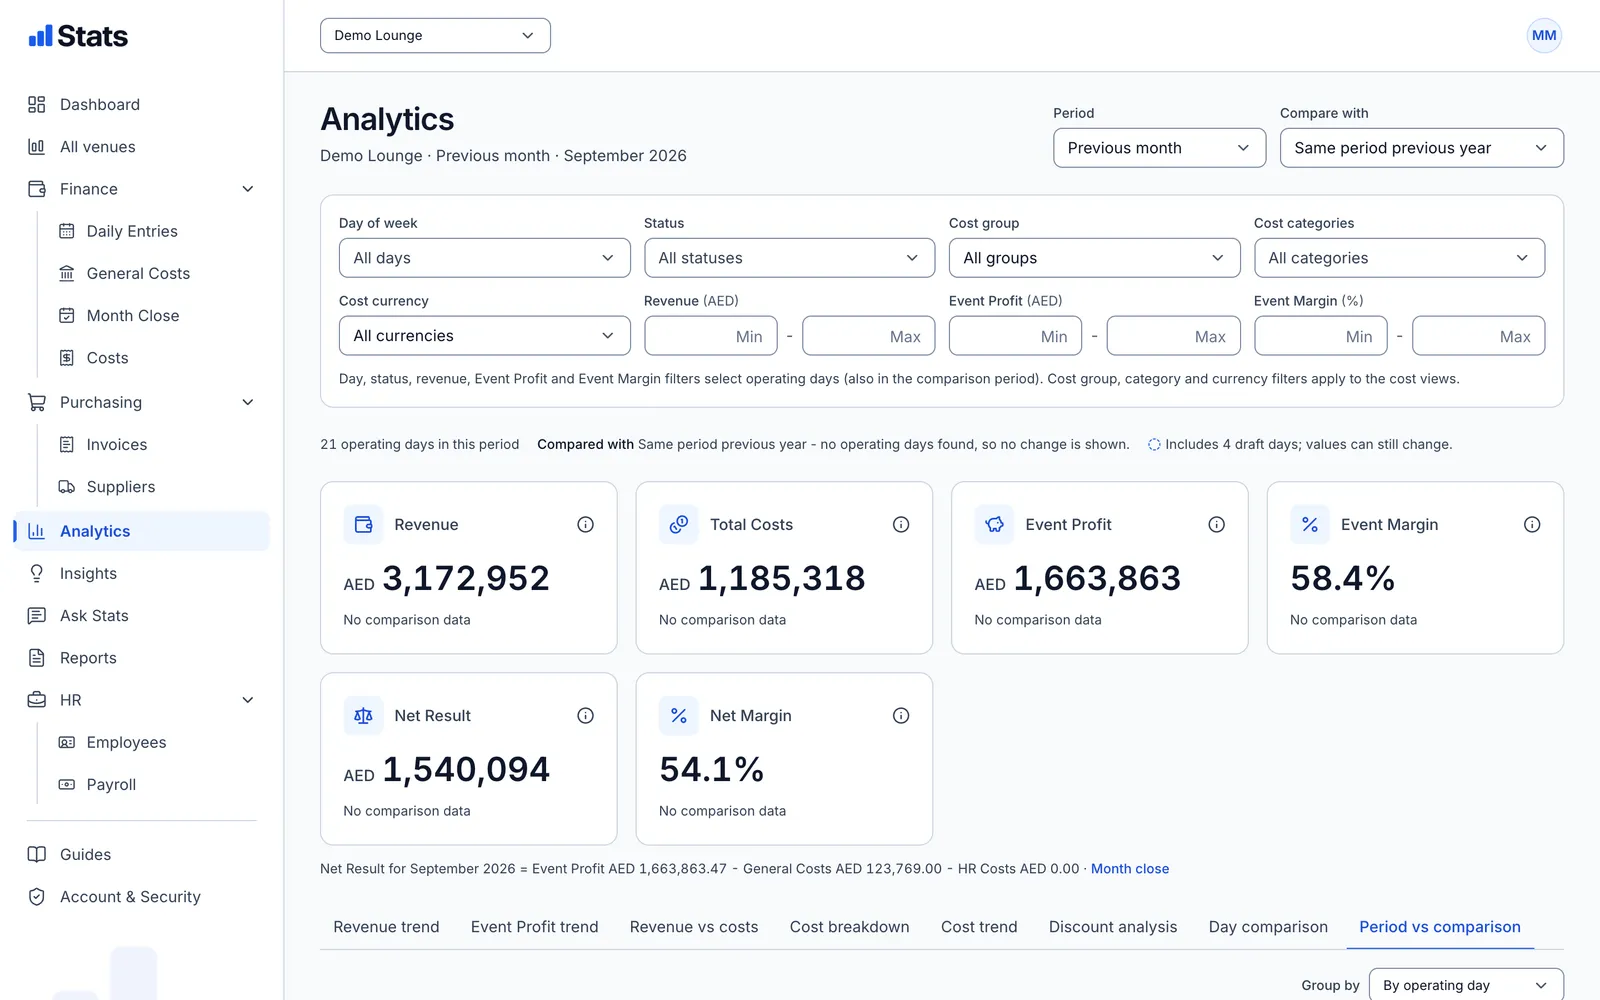
Analytics with filters
Filter by weekday, status, cost group, category, currency, revenue, Event Profit or margin.
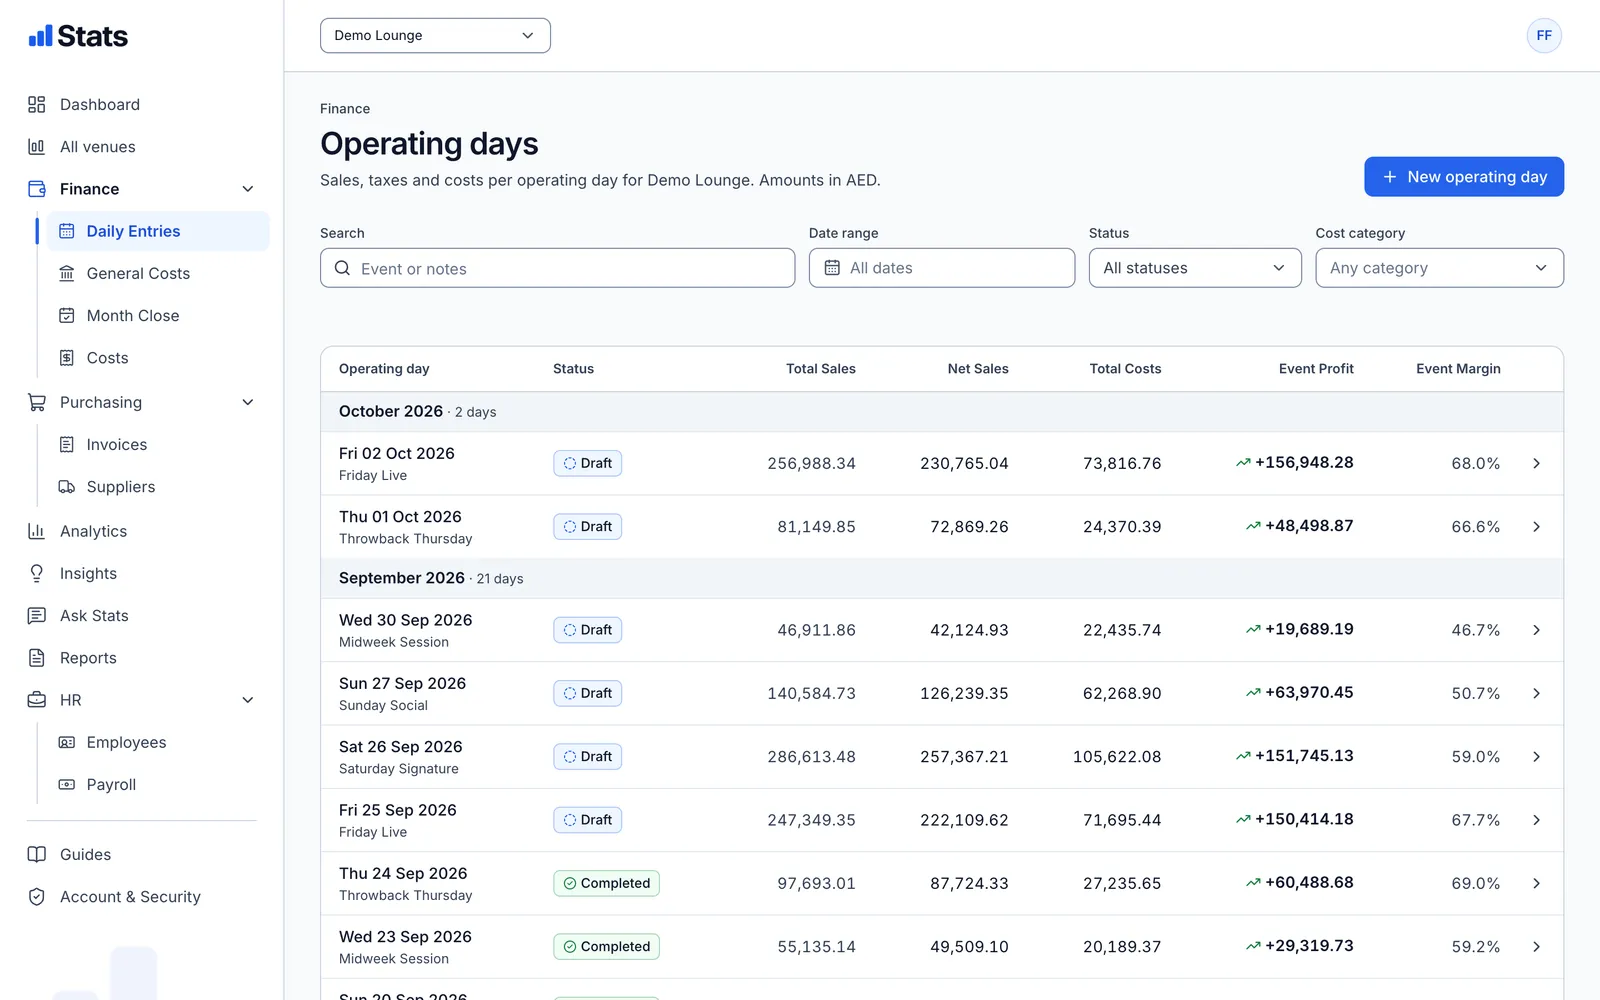
Event Profit
What the night earned, before rent and staff.
Event Profit is Net Sales minus the night's cost of goods, operating costs and other costs. Event Margin shows how much of every dirham of Net Sales you kept.
- One row per night with its event name
- Draft nights are marked until they are completed
- The formula is shown next to the number
Insights
See what changed, and by how much.
Stats compares each night with comparable nights and lists what stands out: a cost far above usual, an Event Profit higher than usual. Mark an insight as reviewed or dismiss it.
- Needs attention and for information, apart
- Thresholds you can read on the page
- A direct link to the night and the cost
Analytics
Trends, costs and discounts over any period.
Revenue and Event Profit trends, revenue against costs, cost breakdown and trend, discount analysis, day comparison and period against period.
- Previous month, same period last year or a custom range
- Group by operating day, week or month
- Every chart can also be shown as a table