Finance
Your finance overview, night by night and month by month.
Enter sales and costs once. Stats calculates taxes and fees, Net Sales, Event Profit and margin for every night, and closes the month with general costs and HR costs into one Net Result.
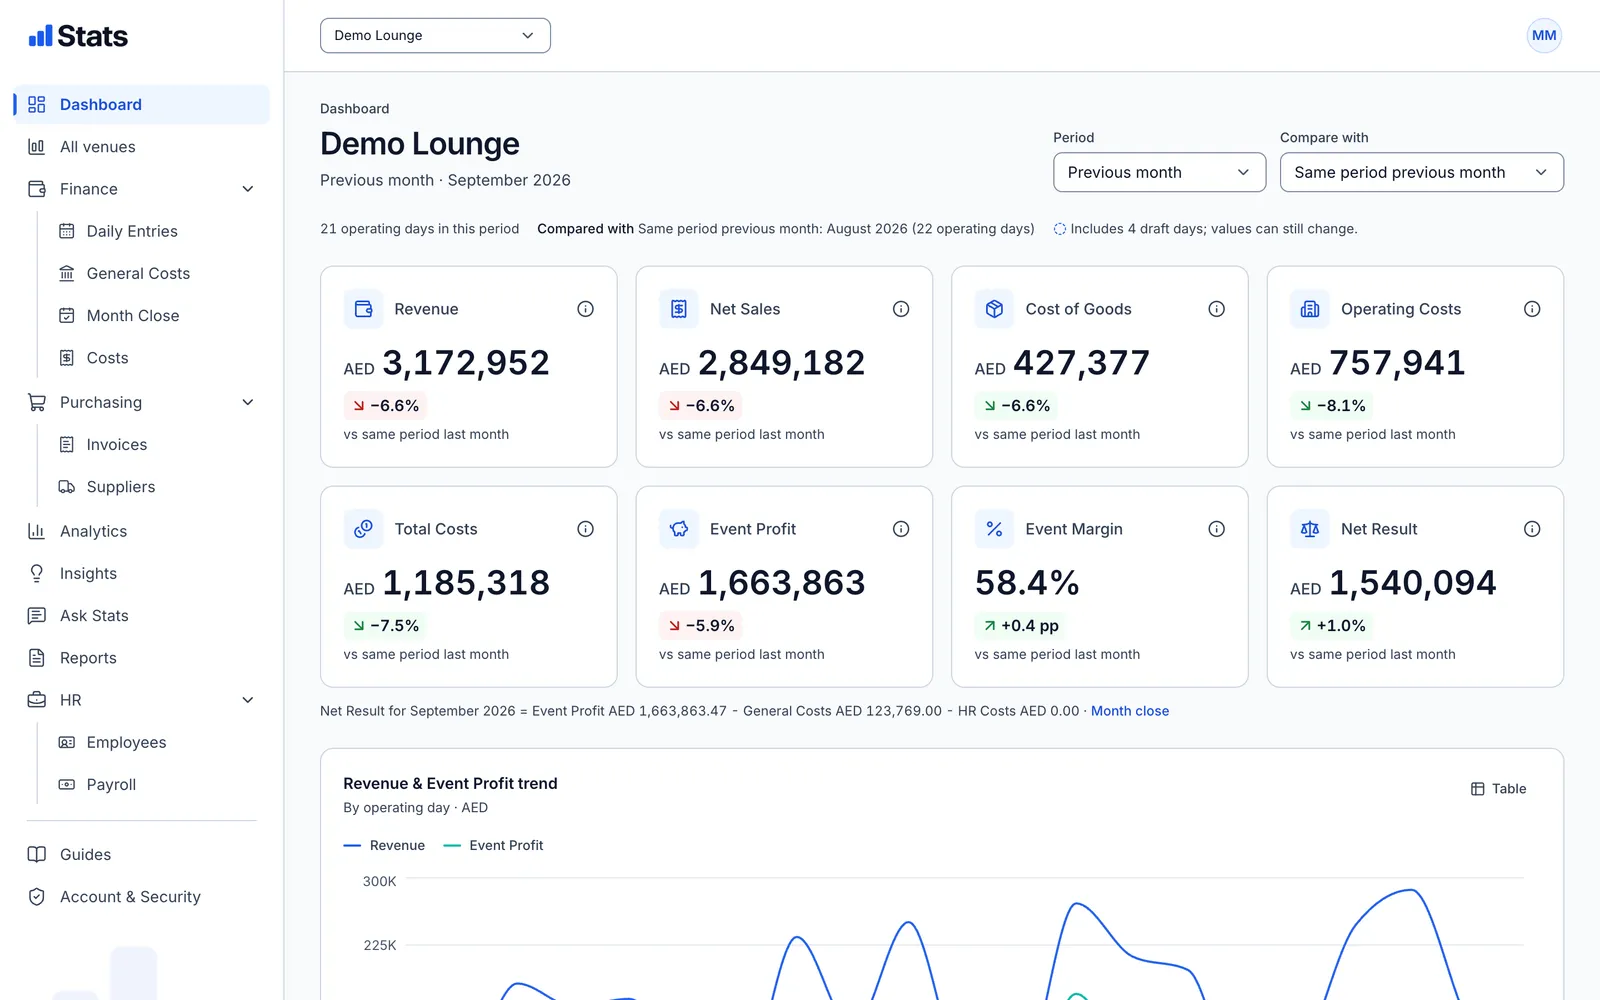
Demo venue with sample data.
Taxes as dated rules
VAT, municipality fee and service charge in the order your accountant uses. Old nights keep their version.
Any currency, AED result
Pay a DJ in USD: the day's rate is locked with the cost, and the result stays in AED.
A month close with a checklist
See what is still open before you close: draft nights, general costs, HR costs and invoices to check.
Daily entries
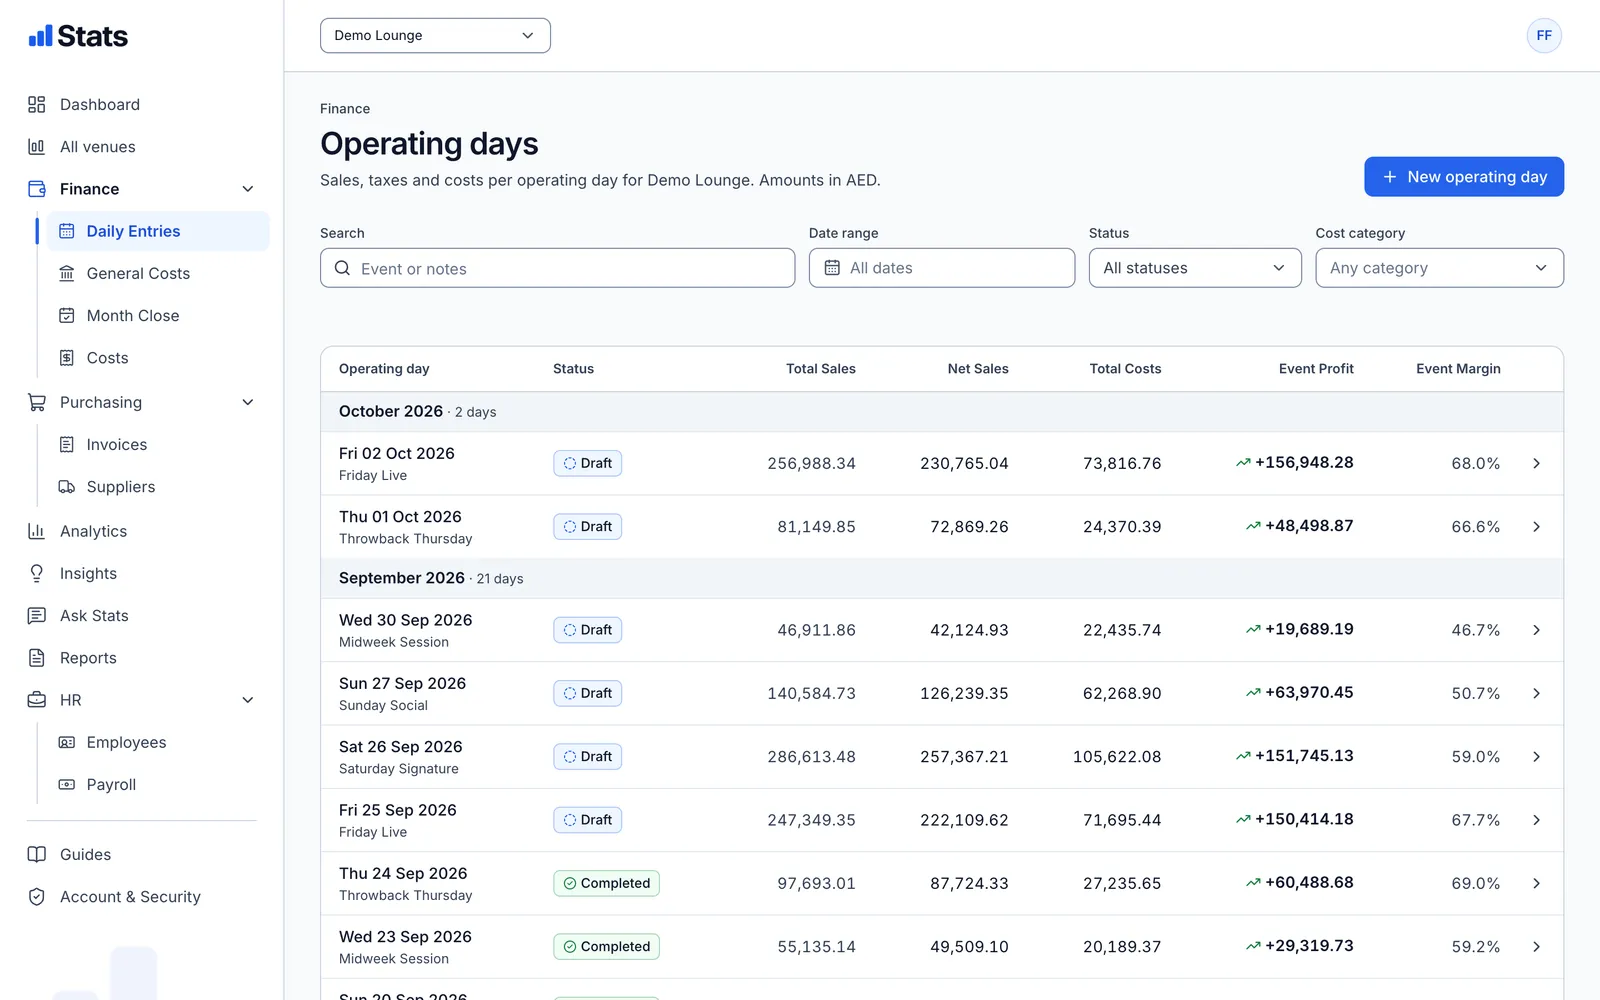
Every night in one list.
Each operating day shows Total Sales, Net Sales, Total Costs, Event Profit and Event Margin, grouped by month, with its status from draft to completed.
- Theoretical sales minus complimentary, refunds, deleted and discounted
- Cost lines per category, in any currency
- A data quality warning when a value is far from comparable nights
Month close
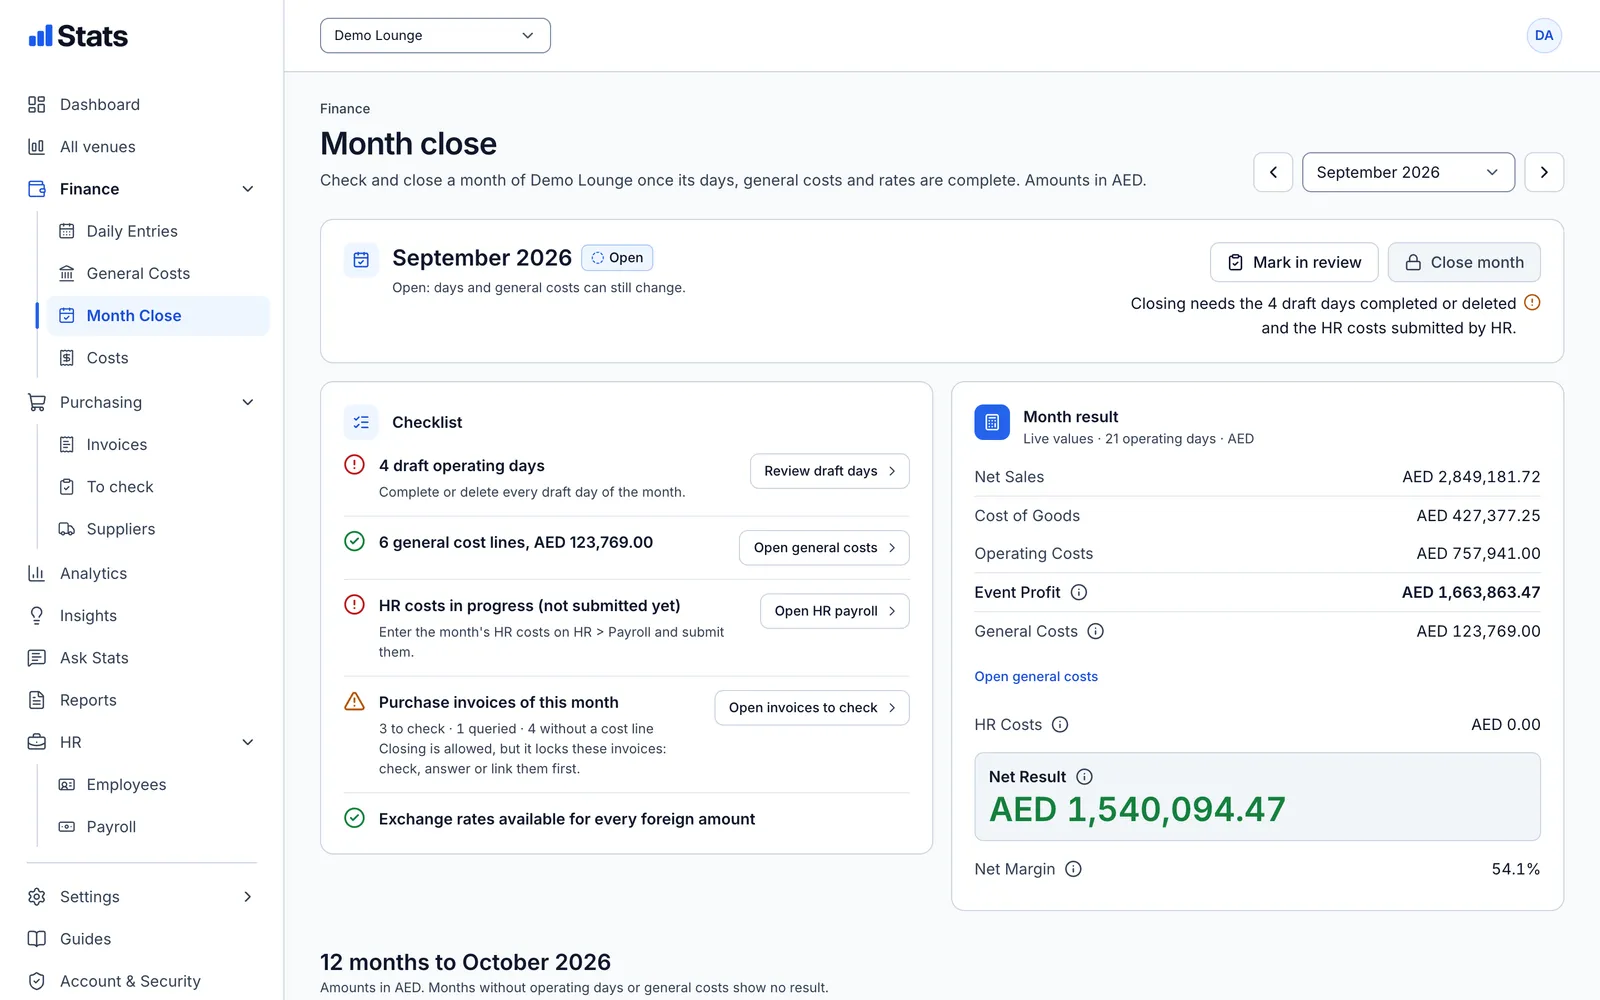
Close the month without surprises.
The month result adds general costs such as rent and licences and the HR costs to the nights. A checklist shows what still needs attention before the month is closed.
- Net Result and Net Margin per month
- General costs per month, never spread over nights
- 12 months at a glance
Reports
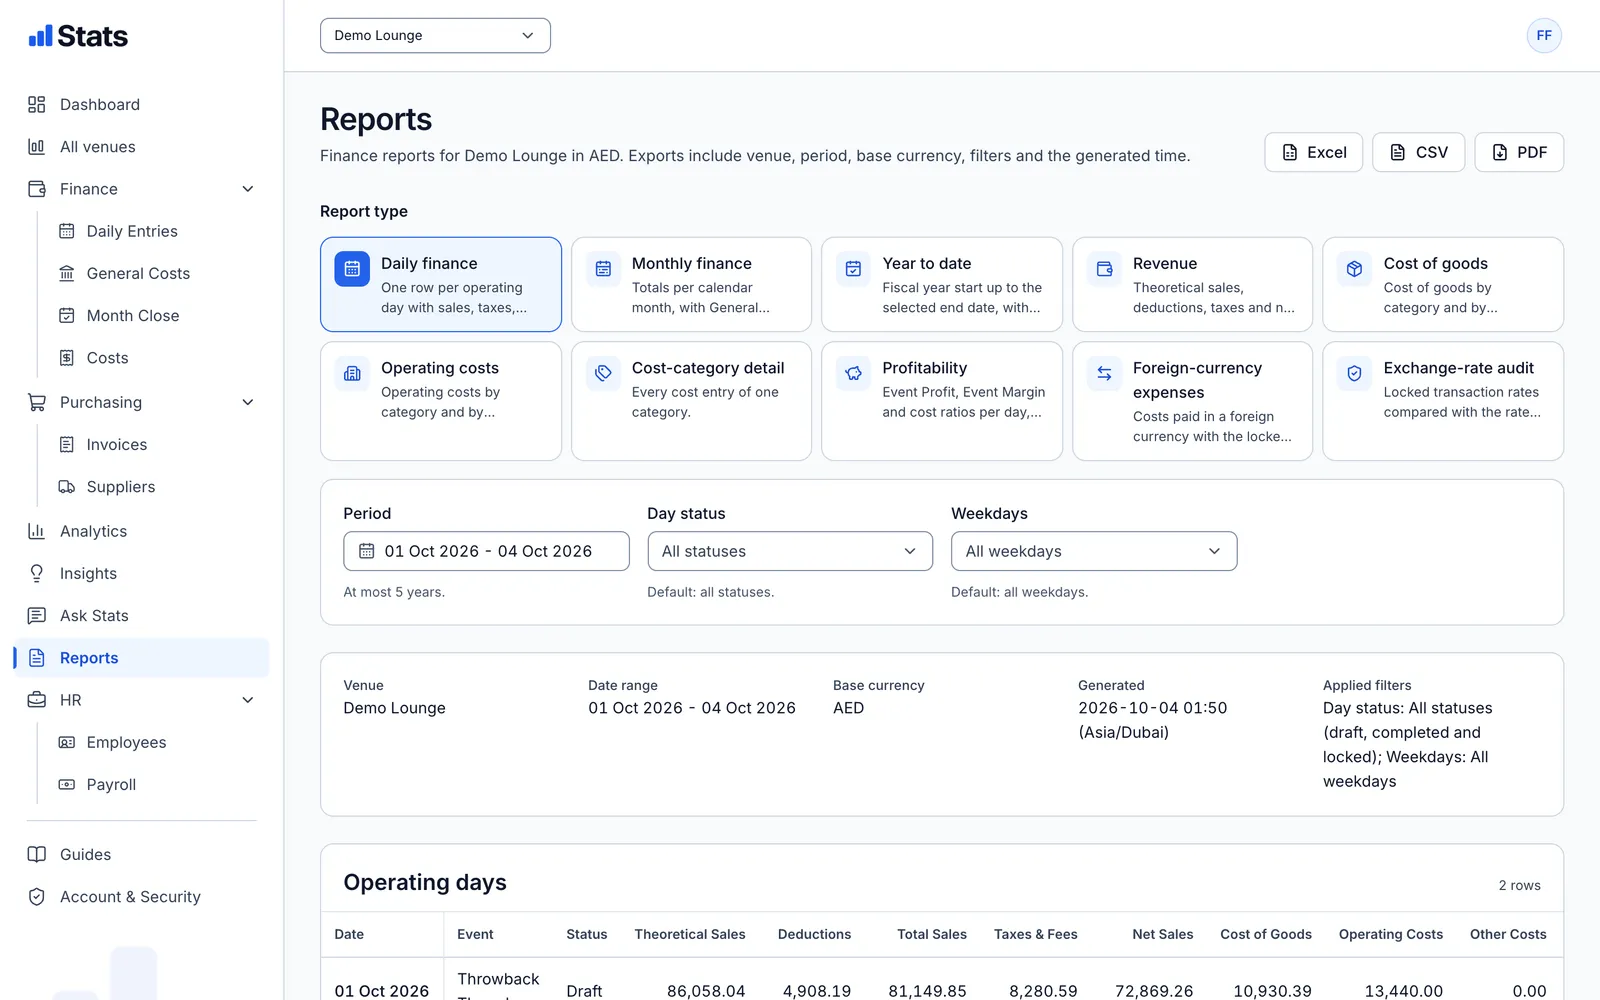
Reports your accountant can use.
Daily and monthly finance, year to date, revenue, cost of goods, operating costs, profitability and foreign-currency expenses. Every export states the venue, period, currency, filters and when it was made.
- Excel, CSV and PDF
- Exchange-rate audit of every locked rate
- Every export is recorded in the audit log
All venues
Every venue side by side.
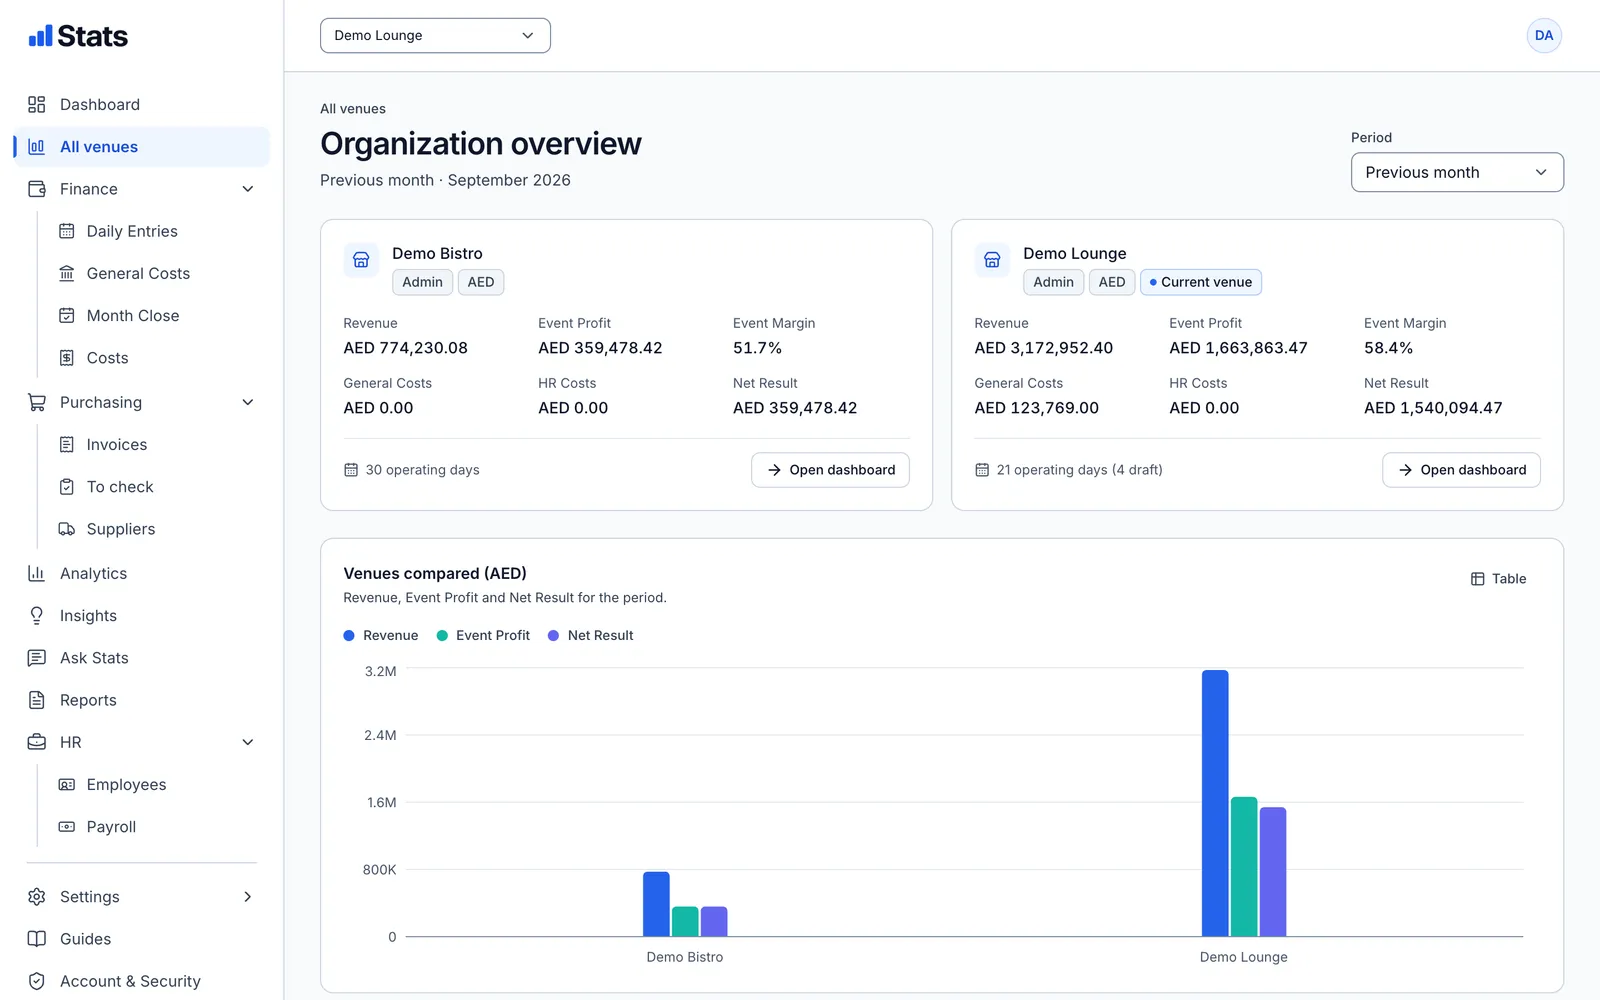
Run more than one venue? The organization overview puts revenue, Event Profit, general costs, HR costs and Net Result of each venue next to each other.
- One login for the whole group
- Access per venue and per role
- Compare venues for any period